By the time I arrived in Pedasi, I already completed V1 of the Plant Collection App, started the burned area mapping literature review and acquired the Landsat OLI monthly composite data during the dry season 2019.
That seems like quite the list already but I still have a lot more to do.

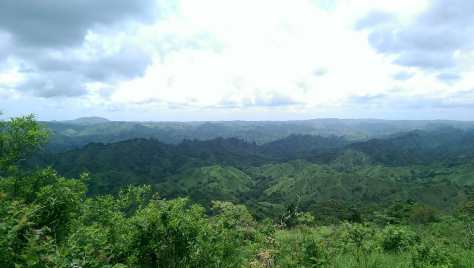
First and foremost, to meet the team and explore the area.
Pro Earth Azuero is an organization based in Panama that does work in reforestation, environmental education and wildlife conservation. The Azuero peninsula in Panama is home to tropical dry forests, which is the most endangered tropical ecosystems in the world, with only 2% left of what was originally there and only 0.09% has conservation status. PEA was founded by scientists to conserve local wildlife through restoring the dry forest they depend upon, and they are working with local landowners and the wider community to accomplish this.
It was a very international team, and apart from being able to learn and practice Spanish, I got to practice my Japanese and French as well. The permanent staff members included people from Panama, USA, and El Salvador, but there were a group of students from France that came over to do reforestation and environmental education work, and a JICA volunteer from Japan. For my first two weeks there, I brought along my fiancee, who also helped out with the reforestation team in the field, and who was actually a good mediator being a native French speaker and also fluent English speaker.


Second, to figure out and test the best methods for mapping burned areas and identify ways to validate these maps.
I attempted a couple different methods to detect burned areas, and at the end decided to use Support Vector Machine, a supervised classification algorithm, to identify the burned areas for the monthly composite Landsat OLI images from February to April. In this way the resulting SVM classification map could be more easily compared to the FIRMS data since the FIRMS data is also taken on a monthly basis. For each composite image for February, March and April, I created a training dataset with the following eight classes: burned area, forest, water, bare area, semi-bare area or old burns, urban, clouds and cloud shadows. Before classifying the image, I created a texture image based on band 7 (SWIR band) based on the following parameters: mean, variance, homogeneity, and contrast. I then stacked the original Landsat OLI image for April (10 bands), with the texture image (4 bands) and the NBR image (1 band, (b5-b7)/(b5+b7)), then classified the stacked image using support vector machine.
After classifying the monthly composite Landsat imagery separately from February to April, I used ArcMap to select only the burned areas for each of them to create a final burned area map for Los Santos over the dry season in 2019. The January composite has very few burned areas and resulted in over-classification of that class, and the May composite had too many clouds over the region, so the final map only includes burned areas from February to April.
There are a couple of different methods for validating my burned area maps. One of which is using higher resolution images as a validation source, and another is using a social survey.
Originally the field team from PEA were going to do fieldwork during the dry season to collect test data, but their schedule got delayed and didn’t end up doing the fieldwork. Instead, since the areas were burned during the dry season and vegetation has already regrown by July (when I visited Panama), another option is to create a social survey for selected farmers to fill out as a method to validate my maps after the fact. However, since social surveys require IRB which takes a long time to get approved, I decided to go for another method.
The method I decided to use to validate my burned area maps is to use a stratified random testing dataset of 100 total points within the spatial extent of Los Santos Province, 50 of which is within the burned areas and 50 within the not burned areas. I then used a higher temporal frequency bi-monthly Sentinel-2 composite data along with monthly Planet composite dataset to validate the three monthly burned area maps.
Third, learn more about what the Artisanal Plants project is about and improve the app.
The Azuero region is renowned as a cultural hub within Panamanian folkloric and artisanal traditions. However, although the region was once largely tropical dry forest, it is now has less than 7% forest cover. The extreme pressure on natural ecosystems has affected the very tree and plant resources that sustain local artisans and their wellbeing. Together with National Geographic, PEA aims to work with local communities to save from extinction both the natural resources and local traditions.
I created an artisanal plant collection app using ArcGIS technologies so volunteers and local artisans can document where local artisanal plants are found and compile that data through this app. In this way a artisanal plant map can be created in the future for local artisans to refer to.
Along with another member working on the artisanal plants project, I first compiled a list of fields that are needed for the form, such as collector, plant species, landowner, collection date, etc., and had them translated into Spanish. After I created the feature class fields in ArcMap, I had to load the feature class as a layer and publish it as a service, then access ArcGIS Online to create the web app. At the end I created a web app using Geoform: https://arcg.is/10jrj11
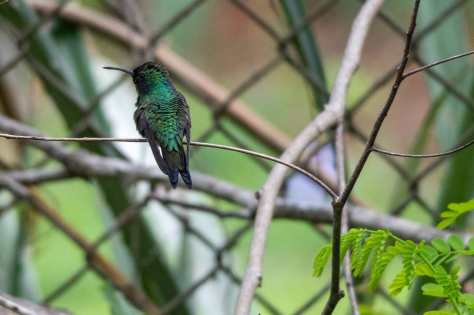
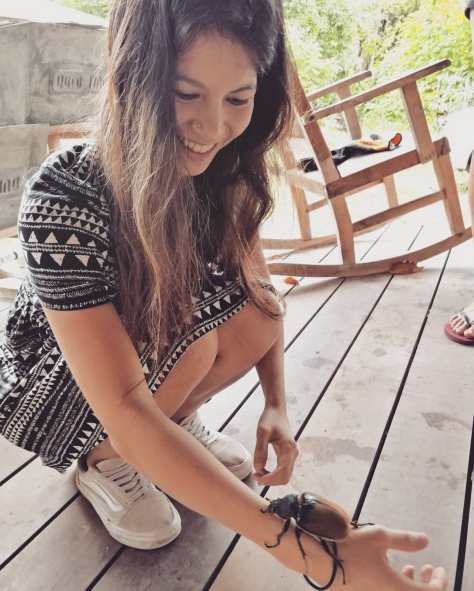
Finally, enjoy the birds, reptiles and insects in Panama.
Panama has one of the highest bird biodiversities on the planet. On a daily basis, we can see flocks of parakeets flying around our office and see different hummingbird species flutter around. There are also many cool insects, in particular beetles! We found a giant female Elephant beetle (scarab) on the road near the office and rescued it so it wouldn’t get run over by a car.
There were also many iguanas in Panama. Also, off the coast of Pedasi there is an island called Isla Iguana! There you can even find black iguanas!

Last but not least, take care of street dogs that follow me home.
Banane is young dog who started hanging out at the Pro Earth Azuero office a couple of weeks before I arrived. He’s super sweet and he walked us home every night. We slowly found out that he used to be owned by a local bakery but his owners thought he had died after he ran away, he was known as Collarito then because of the white collar pattern around his neck. Apparently he was later hit by a car and someone took him to the vet and took care of him. Then he crashed at the local artist’s house for 3 weeks and was named Loki. Now he decided that the office is his home and the volunteers and interns have been taking care of him!